2장 -
데이터 준비 단계
탐색적 분석 단계
통계적 추론 및 기계학습 단계
결과 구현 및 제품화
결과 시각화 및 공유
R : 니터(Knitr)
파이썬 : 주피터(Jupyter) - ipython notebook
------------------------------------------------------------------------------------------------
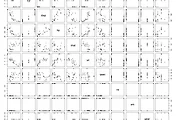
*사용된 함수(mtcars)
mtcars
#통계
head(mtcars, 10)
summary(mtcars)
class(mtcars)
str(mtcars)
table(mtcars) #Error in table(mtcars) : attempt to make a table with >= 2^31 elements
table(mtcars$cyl)
#그래프
hist(mtcars$cyl)
plot(mtcars$wt, mtcars$mpg)
library(ggplot2)
qplot(wt, mpg, data=mtcars, shape=as.factor(cyl)) #shape
qplot(wt, mpg, data=mtcars, size=cyl) #size
#factor 범주형 데이터로 변환하기
a <- mtcars
a
a$cyl2 <- as.factor(a$cyl)
summary(a)
------------------------------------------------------------------------------------------------
3장 - 데이터 수집 및 분석
------------------------------------------------------------------------------------------------
*사용된 함수(pew.txt)
read.delim #txt 파일을 data.frame으로 가져오기
melt(데이터, 기준컬럼명) #풀어내기
sapply(데이터, 함수)
na.omit
qplot(x, y, data)
qplot(x, y, data, size=z)
qplot(x, y, data, shape=as.factor(z))
dplyr 패키지 :
데이터 %>%
group_by( ) %>%
summarize( )
multiplot(qplot1, qplot2, cols=2)
------------------------------------------------------------------------------------------------
4장 - 데이터 분석
------------------------------------------------------------------------------------------------
*사용된 함수(mpg.txt)
read.table
sample_n
kable
ggplot
geom_density
geom_histogram
geom_dotplot
multiplot
select
cor
round
plot
table
mosaicplot
par
jitter #노이즈 발생기(정수 -> 소수)
filter
boxplot
aes
geom_point
geom_smooth
geom_text
dplyr 패키지 :
데이터 %>%
group_by( ) %>%
summarize( ) %>%
filter( ) %>%
distinct( )
------------------------------------------------------------------------------------------------
**소스 수정사항
%>%에서 group_by( ) 할때, 빈값으로 넣기 말고, 기준컬럼 넣어주기
ex) group_by(manufacturer) %>% # 데이터를 제조사 기준으로 그룹하여
%>% 에서 distinct( ) 할 때, .keep_all = TRUE 추가해주기 by Updated for dplyr 0.5
출처: http://stackoverflow.com/questions/22959635/remove-duplicated-rows-using-dplyr
ex) distinct(model, .keep_all = TRUE) # 차량별로 한대씩만 남긴다.
------------------------------------------------------------------------------------------------------------------------------
참고:
헬로 데이터 과학 소스
https://github.com/jykim/dbook
헬로 데이터 과학 - 저자 블로그
http://www.hellodatascience.com/
R을 이용한 데이터 분석 실무
http://r4pda.co.kr/
R 기반의 데이터 시각화
http://freesearch.pe.kr/archives/3891
기타;
[IT특집] 머신러닝의 충격
http://ch.yes24.com/Article/View/28788?Scode=050_002
사례:넷플릭스 프라이즈 문제 정의
http://www.netflixprize.com/rules
http://www.netflixprize.com/assets/rules.pdf
RMSE : Root Mean Squared Error
캐글
www.kaggle.com/competitions
결측치 관리
https://en.wikipedia.org/wiki/Missing_data
'R > 헬로 데이터과학' 카테고리의 다른 글
| plot(mtcars) (0) | 2016.11.29 |
|---|---|
| R 통계 - 기본 기능(탐색적 분석 (0) | 2016.11.29 |
| R 개요 (0) | 2016.11.19 |


